
What is Shiny?
Shiny is an R package developed by RStudio that adds the ability to build interactive web applications to R. With Shiny You can write your apps in R and put it in a web browser so that others can easily use it. In other words, Shiny creates web applications deployed on the web using your server or R Shiny’s hosting services.
By using Shiny, you can:
- Create information dashboards
- Create interactive demos for teaching statistics
- Present data in a more attractive way
- Make sophisticated R analyses available to users with no programming skills
Main structure of a shiny app
Every Shiny app consists of two main parts: UI (User Interface) and server.
The UI determines the appearance of your app (the types of inputs and outputs are defined in this part). And the server determines how your app works (setting the inputs and outputs as well as updating the outputs is done in this part).
Options
Shiny has provided its users with many features for designing the app. For example, you can use actionButton, actionLink, radioButtons, checkbox, selectInput, fileInput and etc (find more in shiny-cheatsheet) to design your app. You can also change the theme layout and font of your apps.
Example
In the following, we present examples of Shiny:
1. Generate data from normal distribution (Simple example)
library(shiny)
ui<- fluidPage(
numericInput(inputId = 'n', 'size', 100),
plotOutput(outputId = 'hist'),
br('Summary:'),
verbatimTextOutput(outputId = 'summary')
)
server<- function(input, output){
x<- reactive(rnorm(input$n))
output$hist<- renderPlot({
hist(x(), main = 'Histogram', xlab='x')
})
output$summary<- renderPrint({
x<- rnorm(input$n)
summary(x)})
}
shinyApp(ui= ui, server= server)
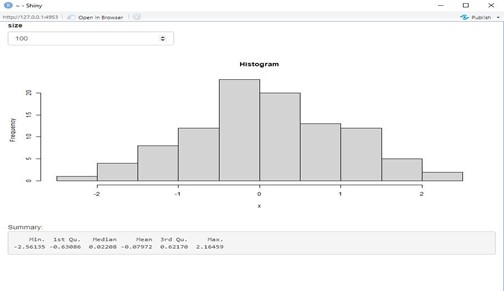
By running this code, you’ll have a shiny app, that generates random data from a normal distribution by taking the sample size from the user, then displays a histogram and summary of the data.
2. Simple linear regression (More complicated example)
library(shiny)
library(sn)
data(ais)
ui<- fluidPage(
titlePanel("Simple Linear Regression Using R (Data: ais)"),
sidebarLayout(
sidebarPanel(
selectInput('dv', "Dependent Variable", choices = names(ais)[3:length(names(ais))], selected = "Ht", multiple = F),
selectInput('idv', "Independent Variable", choices = names(ais)[3:length(names(ais))], selected = "Wt", multiple = F),
radioButtons('nrmt', "Choice a case for testing normality of residuals:", c("Shapiro wilk", "kolmogorov-smirnov"))
),
mainPanel(
tabsetPanel(
tabPanel("data", "Data Set", tableOutput("dt")),
tabPanel("Descriptive Variables",verbatimTextOutput("str") ),
tabPanel("Model",h4("Model Summary"), verbatimTextOutput("mdl")),
tabPanel("Plot",h4("Scatter Plot"),plotOutput("p")),
tabPanel("Normality", h4("Noemality test of residuals"),verbatimTextOutput("nrm"), plotOutput("np"))
)
)
))
server<- function(input, output, session){
Model<- reactive({lm(ais[,input$dv] ~ ais[,input$idv])})
output$dt<- renderTable({ais})
output$str<- renderPrint({
str(ais)
})
output$mdl<- renderPrint({
summary(Model())
})
output$p<- renderPlot({
plot(ais[,input$idv], ais[,input$dv], main= paste('beta1.hat= ', round(Model()$coef[2],2), ', pearson.cor= ', round(cor(ais[,input$idv],ais[,input$dv]),2)),
xlab= input$idv, ylab= input$dv)
abline(Model(), col=2)
})
output$nrm<- renderPrint({
if(input$nrmt == "Shapiro wilk") shapiro.test(Model()$res) else ks.test(Model()$res, "pnorm")
})
output$np<- renderPlot({
qqnorm(Model()$res)
qqline(Model()$res, col=2)
})
}
shinyApp(ui, server)
In this example, we have shown how to write an app to perform simple linear regression on a data set using shiny. (Here we used the ‘ais’ data available in the ‘sn’ package).
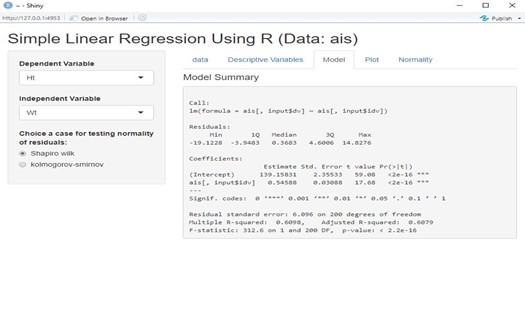
(You can see more example in: https://shiny.rstudio.com/gallery/).
How to learn shiny?
We suggest the following resources to learn shiny:
- ‘Mastering Shiny’ book, written by Hadley Wickham
- ‘shiny.rstudio.com’ website
- Shiny cheatsheets